
Back to Hunovo
LIO
Website and internal tracking dashboard
LIO needed a public site that explained the business, and an internal tool that told them what was actually happening inside it. We built both, six weeks apart.
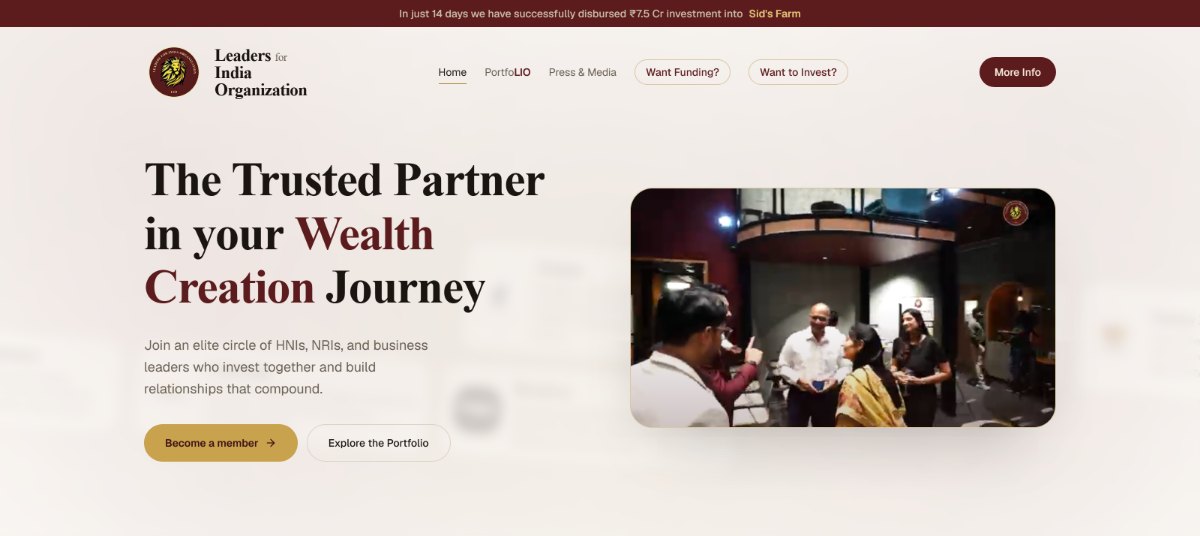
The public site 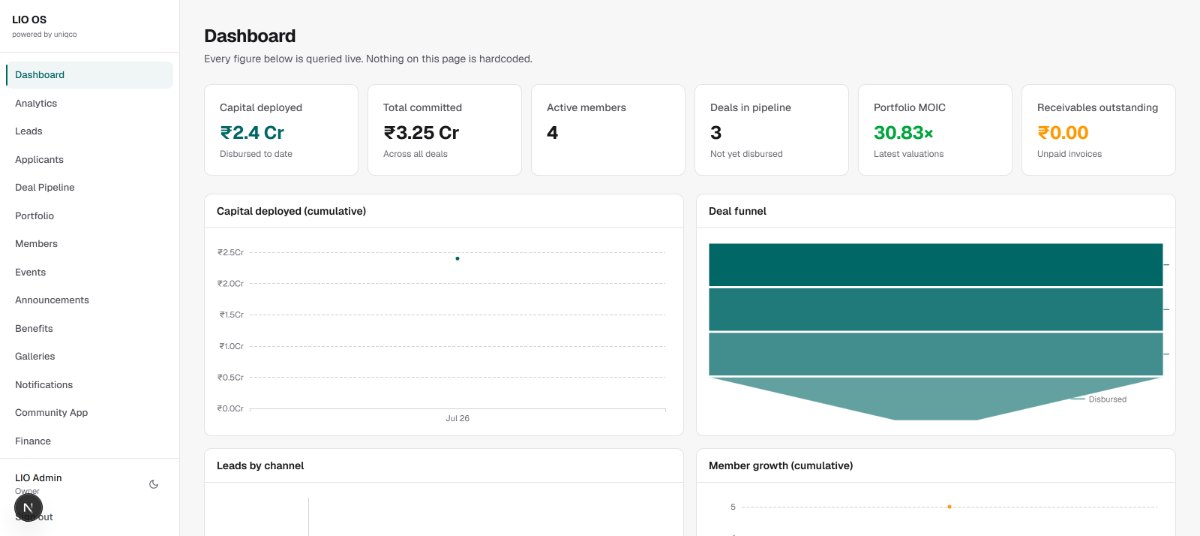
Dashboard, queried live 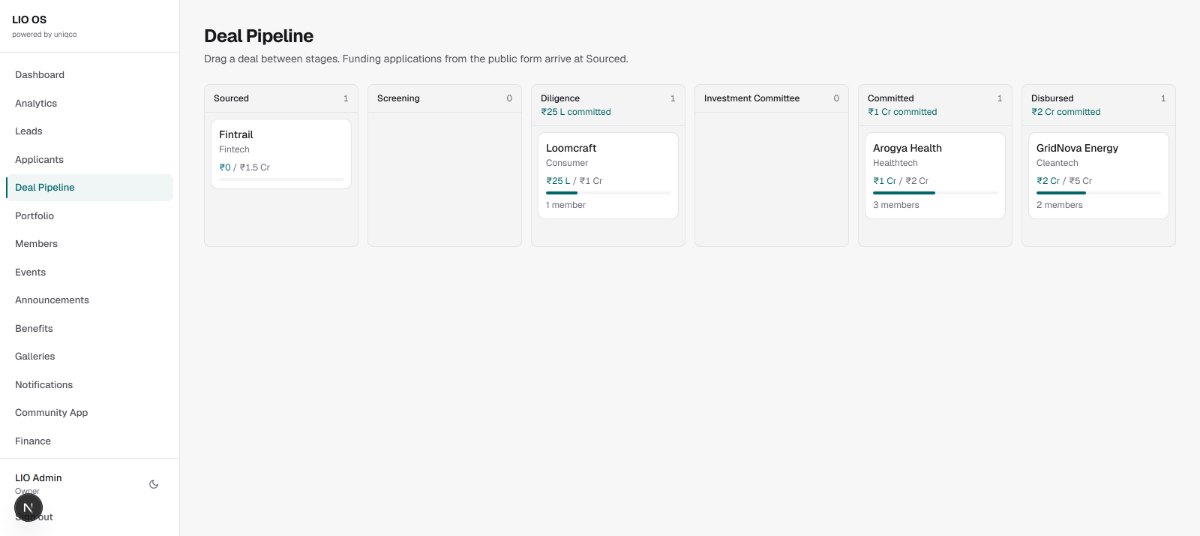
Deals, stage by stage 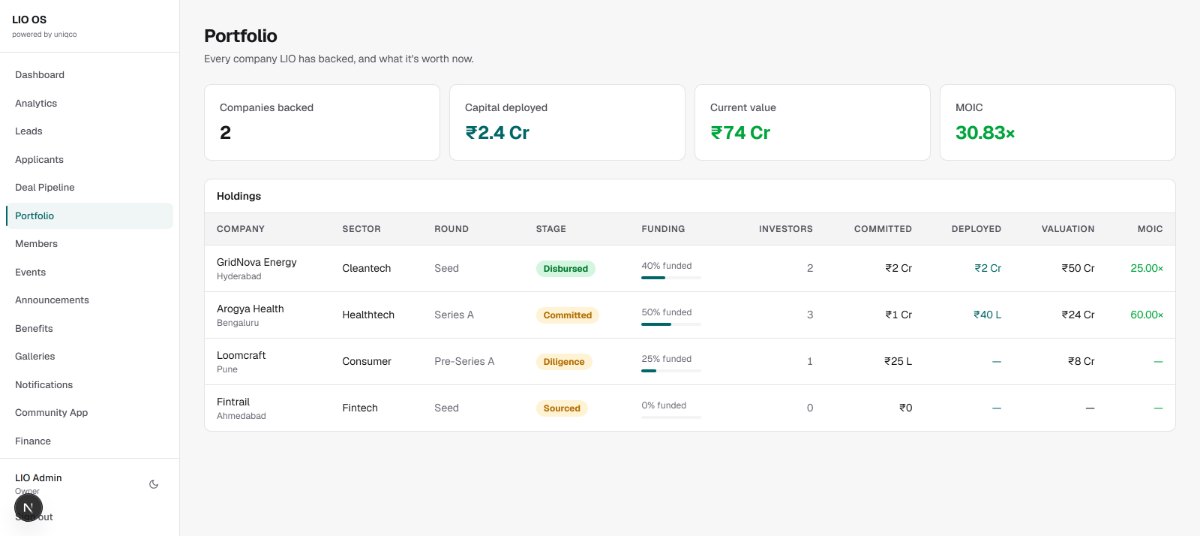
Holdings and what they are worth
How the project ran
The problem
Two audiences, one story
The public site had to sell the business while the internal tool had to run it. Same vocabulary, two very different jobs.
What we did
One data model first
We modelled the operation before designing a screen, so the dashboard reflects how LIO actually tracks work.
The build
Shipped weekly
Live environment from week one, reviewed with their ops lead every Friday.
Outcome
Adopted, not mandated
The team moved off spreadsheets because the tool was faster, not because they were told to.